Core Developer @ Hudson River Trading
On 4/21/2021, 12:16:36 AM
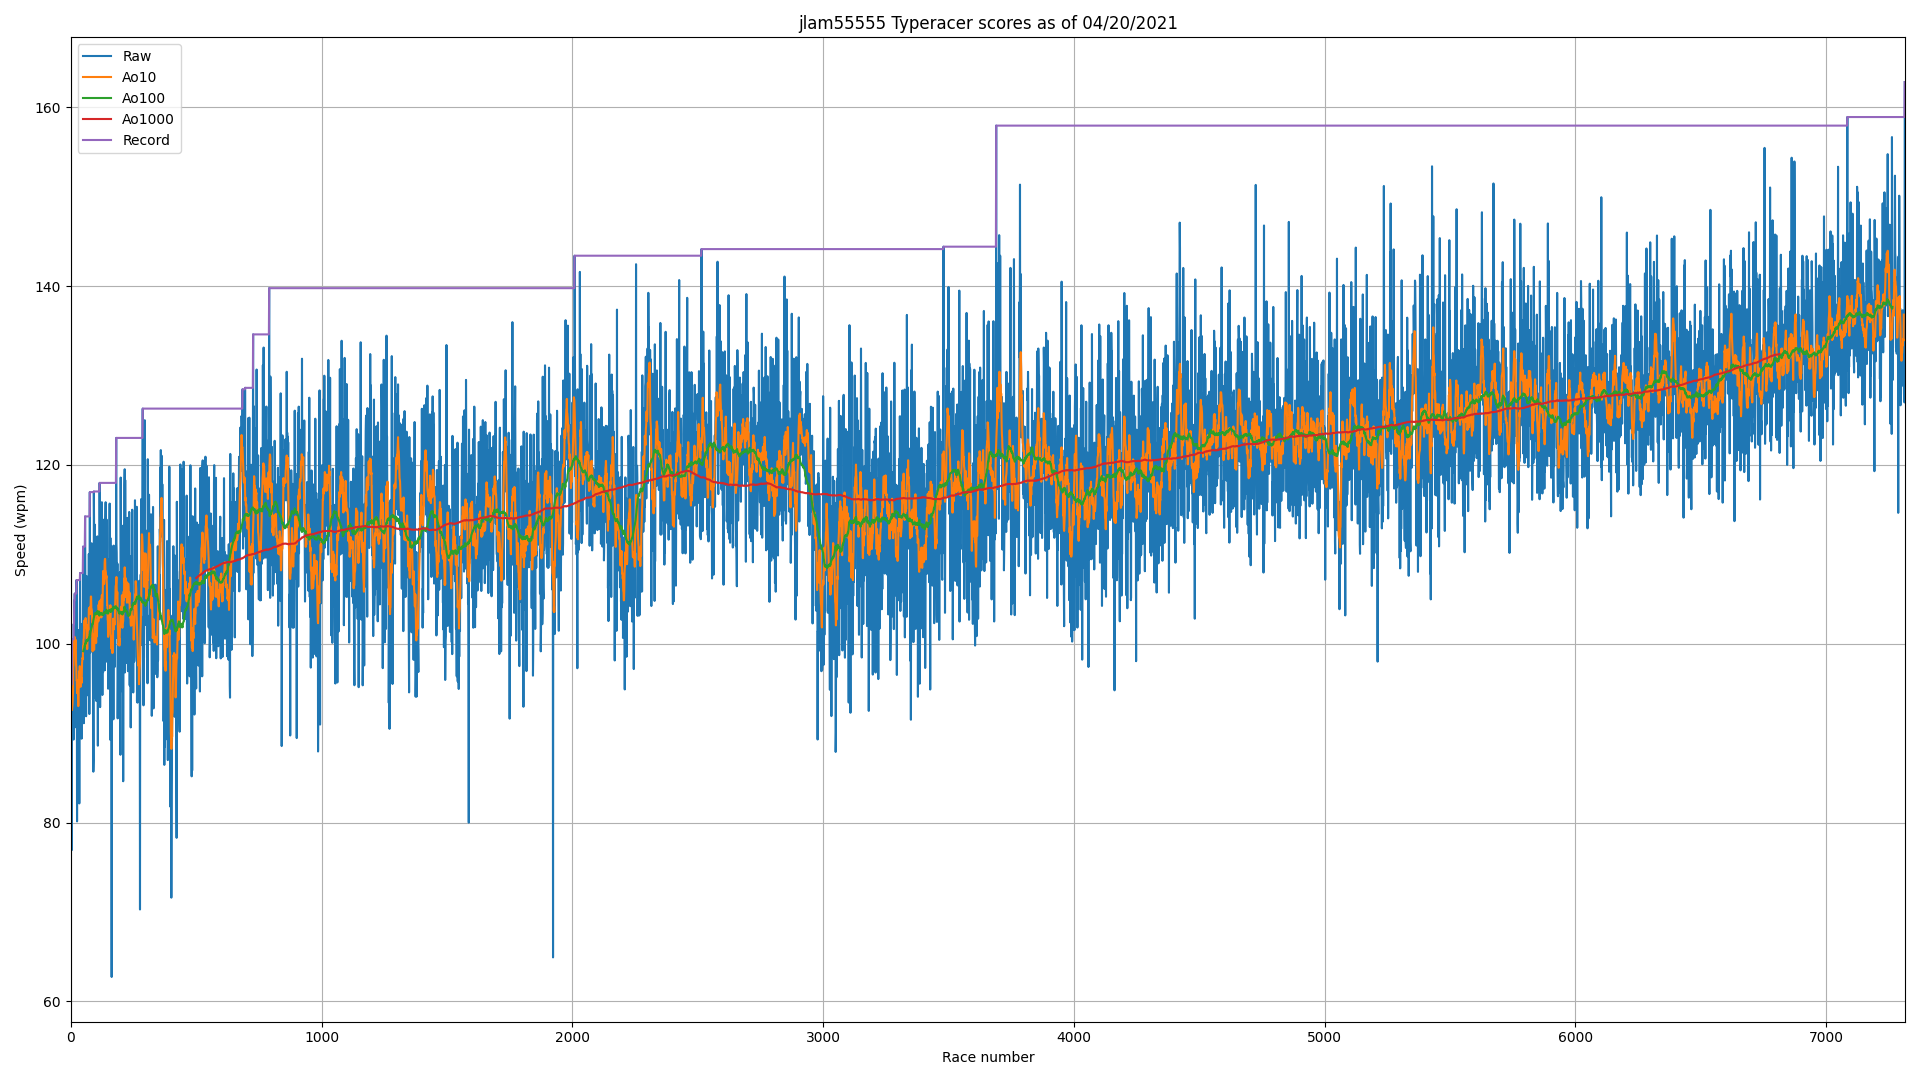
I recently broke my record in TypeRacer, so I thought I'd write a script to show my results over time. Here's it is.
This is actually my first time using a web scraper. BeautifulSoup is pretty nice.
The numerical running means and "running maxima" is not the most efficient, but it shouldn't be too bad with only a few thousand data points. The larger bottleneck is whether typeracerdata.com's server's can keep up for users with a large number of races.
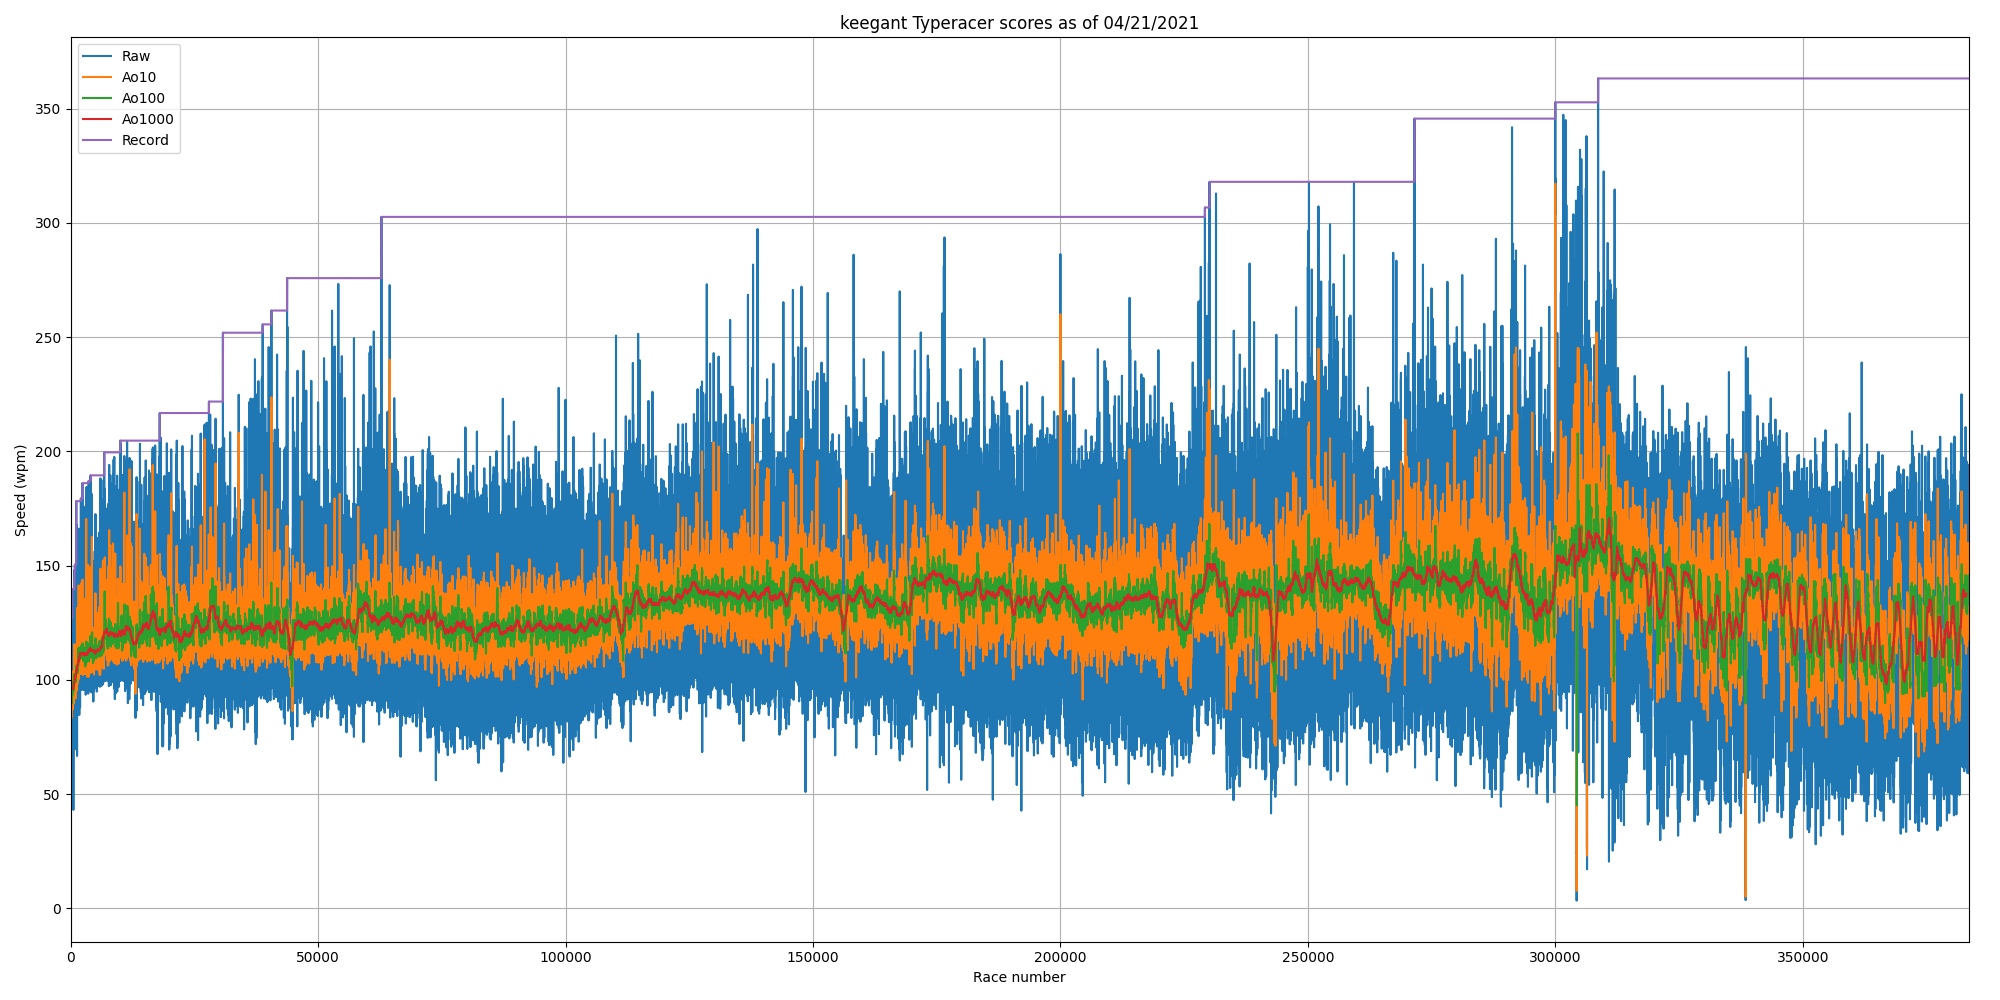
As a stress test, I tried running the script on keegant, the user with the most TypeRacer races. Roughly speaking1, the HTML from typeracerdata.com took around 7 minutes and ate up 4.5GB of RAM, and the extra numpy arrays took up an extra 0.6GB and the processing (running mean and maxima) took about a second. See the output in the results section.
The end result definitely isn't perfect or complex, but it is pretty fun to see the progression over time. A possible improvement is that the horizontal axis is time rather than number of races (this would require parsing and storing the date values, which are also available on typeracerdata.com). The TypeRacer Discord server has a bot that allows you to view results as a function of either number of races or time, but (afaik) it doesn't give you control over the moving average or plot running maxima.
python3 scrape.py [USERNAME]
import matplotlib.pyplot as plt
import numpy as np
from datetime import date
from bs4 import BeautifulSoup
import requests
import sys

if len(sys.argv) < 2:
    print('Usage: python3 scrape.py [username]')

# max_races should be > total number of races
username = sys.argv[1]
max_races = 10000

# scrape from typeracerdata
url = f'http://typeracerdata.com/profile?username={username}&last={max_races}'
page = requests.get(url)

soup = BeautifulSoup(page.content, 'html.parser')
data = np.array(list(map(lambda elem: float(elem.getText()), soup\
        .find_all('table', class_='profile')[2]\
        .select('td:nth-child(3)'))))

# reverse data
data = data[::-1]

# calculate average of N
averageofs = [10, 100, 1000]
def aveof(n):
    x = np.zeros(shape=(len(data)-n+1,))
    t = np.arange(n/2, n/2+len(data)-n+1)
    # set the zeroth element
    x[0] = np.sum(data[:n])
    # set the rest
    for i in range(1, len(data)-n+1):
        x[i] = x[i-1] + data[i+n-1] - data[i-1]
    x /= n
    return t, x

# calculate maximums
rolling_max = np.zeros_like(data)
curr_max = -1
for i, val in enumerate(data):
    if val > curr_max:
        curr_max = val
    rolling_max[i] = curr_max

# plot and save figure
plt.figure(figsize=[20, 10])
plt.plot(data)
for n in averageofs:
    plt.plot(*aveof(n))
plt.plot(rolling_max)
plt.grid('on')
plt.title(f'{username} Typeracer scores as of {date.today().strftime("%m/%d/%Y")}')
plt.xlabel('Race number')
plt.ylabel('Speed (wpm)')
plt.legend(['Raw'] + list(map(lambda x: f'Ao{x}', averageofs)) + ['Record'])
plt.tight_layout()
plt.xlim([0, len(data)])
plt.savefig(f'{username}{date.today().strftime("%d%m%Y")}.png')
Sample: my scores (username "jlam55555")
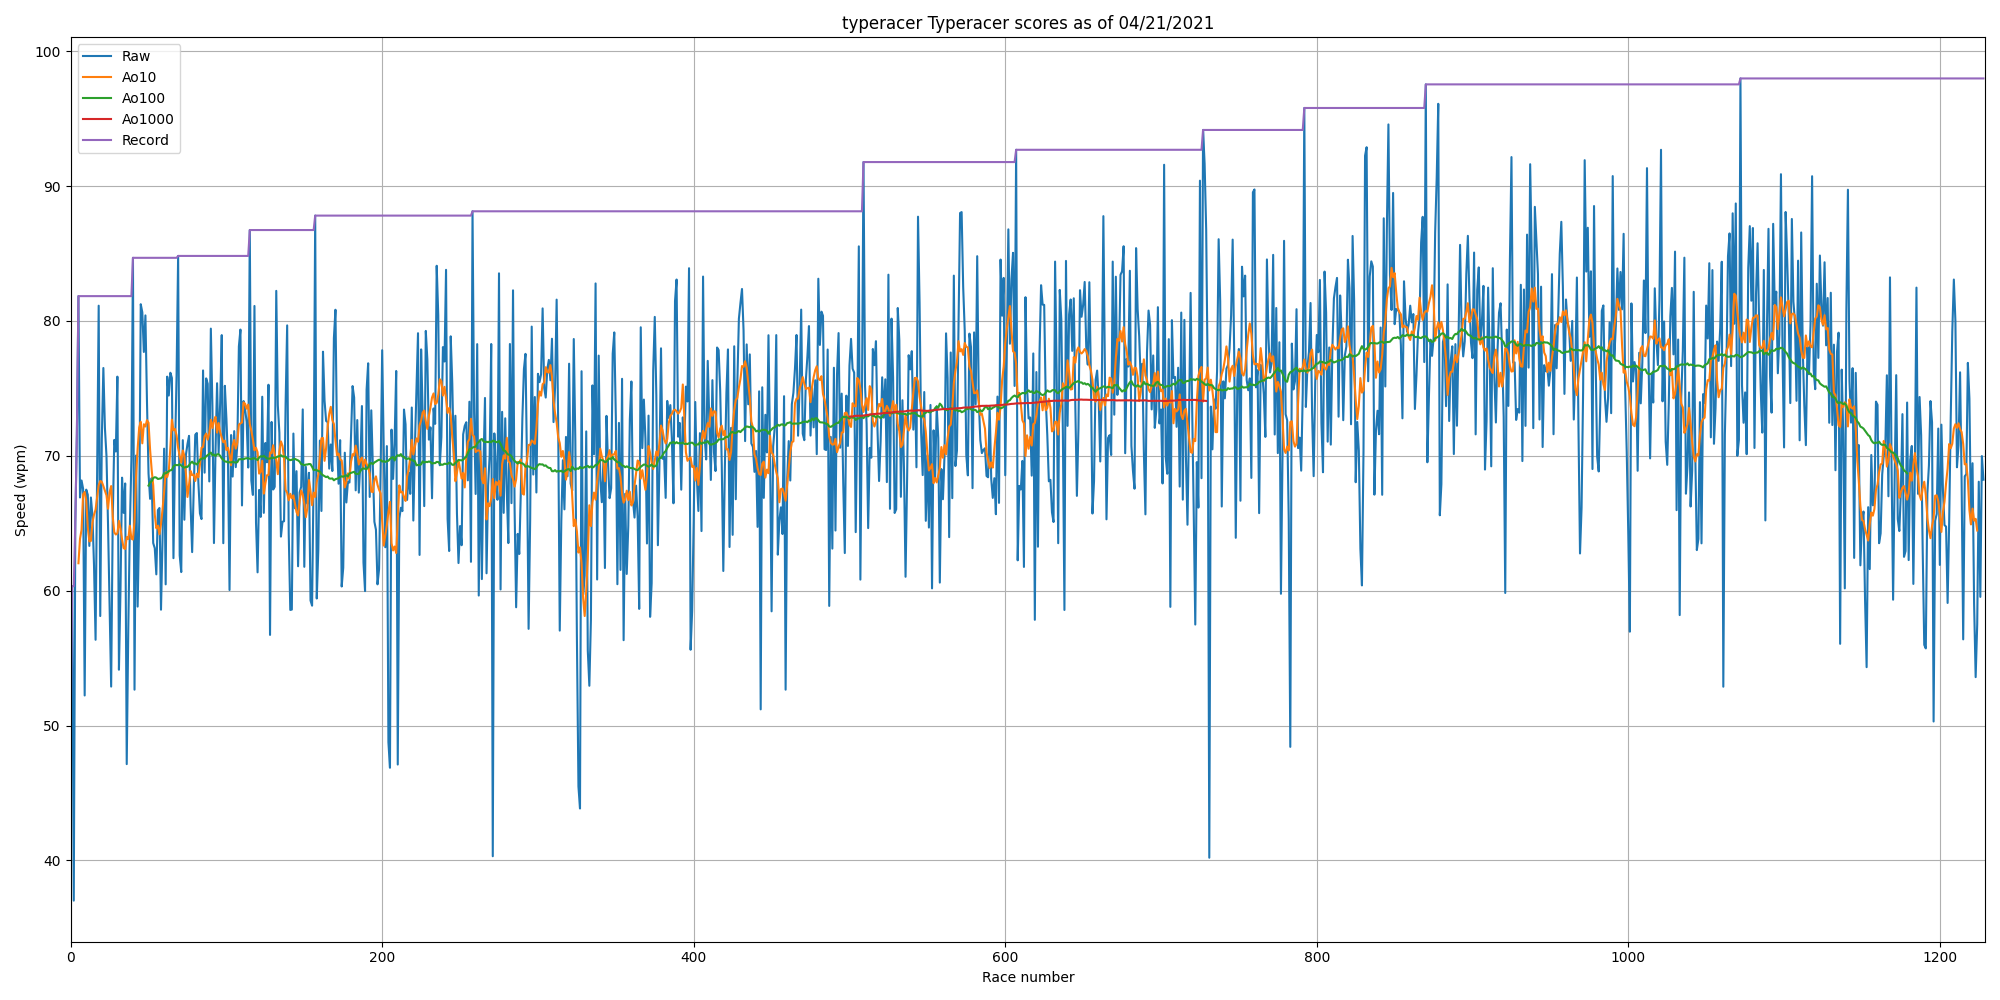
Sample: the creator of TypeRacer (username "typeracer")
Sample: the user with the most races on TypeRacer (username "keegant")
1. These estimates were performed by anxiously watching htop, hoping that I wouldn't run out of RAM
© Copyright 2025 Jonathan Lam